Configuring Charts
Data can be displayed as charts or cross-tabs that include data that is specific to the each of the Group Headers and Footers. The Top Chart section of a report can be used to display one or more charts before the Report data table. The Bottom Chart section of the report can be used to display one or more charts after the Report data table.
SmartInsight comes with various chart types that can be used for Reports. These chart types include:
- Pie Charts
- Bar Graphs
- Line Graphs
- Column Charts
- Stacked Charts
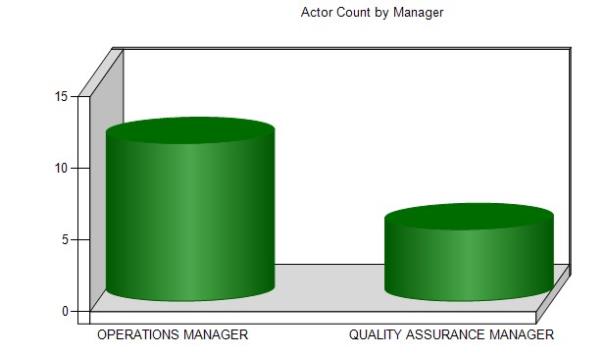
Example Chart
Follow the steps below to create a chart.
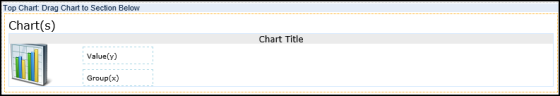
- Drag and drop the Chart object from the Design tab located on the right side of the window, to the desired location in the Top Chartor Bottom Chart section of the Design canvas.
Result: The Chart object now displays in the Chart section in the Design canvas.
- Click the Chart object just placed in the Chart section of the canvas.
Result: The Properties dialog for the Chart object is displayed in the Design panel located on the right side of the window
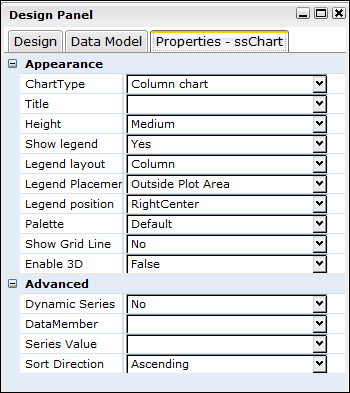
- Click the drop down arrow in the ChartType field and select type of chart to display.
Result: The ChartType field displays the selected option. - Click the Title field and enter a title for the chart.
- Set any other applicable properties.
- Save the report by selecting Report > Save from the main menu.
The following table provides descriptions for the Chart property settings available for reports:
| Property | Description | Grouping |
|---|---|---|
|
Chart Type |
Determines the chart type to be displayed in the report. Chart types include many different variations of Column Charts, Bar Charts, Pie Charts, Area Charts, and Line Charts. |
Appearance |
|
Title |
Determines the chart title that will appear in the header of the top and or bottom chart. |
Appearance |
|
Height |
Determines the height of the chart.
Choices are:
|
Appearance |
|
Show Legend |
Determines if the legend will be displayed with the chart.
Choices are:
|
Appearance |
|
Legend Layout |
If Show Legend is set to Yes, this property determines the layout of the legend.
Choices are:
|
Appearance |
|
Legend Placement |
If Show Legend is set to Yes, this property determines whether the Legend should be displayed inside or outside the plot area.
Choices are:
|
Appearance |
|
Legend Position |
If Show Legend is set to Yes, this property determines where within the plot area the legend will be displayed.
Choices are:
|
Appearance |
|
Palette |
Determines the color scheme of the chart.
Choices are :
|
Appearance |
|
Show Grid Line |
Determines if horizontal grid lines will be shown in the report. Choices are:
|
Appearance |
|
Enable 3D |
Determines whether to display the Chart in 3D visual effect or not.
Choices are:
|
Appearance |
|
Dynamic Series |
Determines if a Series value will be created by a series. If Yes, select the Series value.
Choices are:
|
Advanced |
|
Data Member |
Determines the data model used for the Dynamic Series. All controls inside the Chart section have to be from this data model parent or child nodes. |
Advanced |
|
Series Value |
If the Dynamic Series Property is set to Yes, enter or select a field or an expression to generate the Series.
Choices are:
|
Advanced |
|
Sort Direction |
Determines the direction in which the series will sort.
Choices are:
|
Advanced |